Simply put, a Gantt chart is a horizontal bar chart that serves a valuable function in project management, i-e to visually characterize the project plan over a period of time. Gantt charts are ideal for defining the status and timeline of the project, as well as for identifying who is responsible for each task.
Some of the key factors covered by a Gantt chart include:
-
How a project is segregated and broken down into different tasks
-
The estimated duration of each task and when it will start and end
-
The persons responsible for each assignment
-
How the tasks are interrelated and help to achieve an identical result in the case
-
A recognition for important deadlines and meeting
-
The identification of the step-by-step progress of the project
A Historical Perspective on the Gantt Chart
Were you aware that the first project management chart was actually introduced by Karol Adamiecki in 1896? The lesser-known fact rather gets outshone by the more famous Gantt chart that we have today. Adamiecki’s own version of the chart was identified as her monogram, but it was not published until 1931.
On the other hand, Henry Gantt’s project management systems gained far-reaching popularity after it was introduced in the 1910s and became the go-to option for creating illustrations of project timelines. While Adamiecki's contribution may have been overshadowed, it's important to recognize the innovative work he did in the field of project management.
For a complete set of project management tools, make sure to incorporate user stories into your planning process. Learn more about user stories here.
Learning how to read a Gantt chart
It's no secret that a Gantt chart looks daunting at first glance. However, once its fundamentals are understood, it becomes easy to talk about the exact status of projects and the targets remaining for completion.
Reading a Gantt chart becomes super convenient once you understand the various elements that make it up and how they fit together to make the project plan work.
What are the components of a Gantt chart?
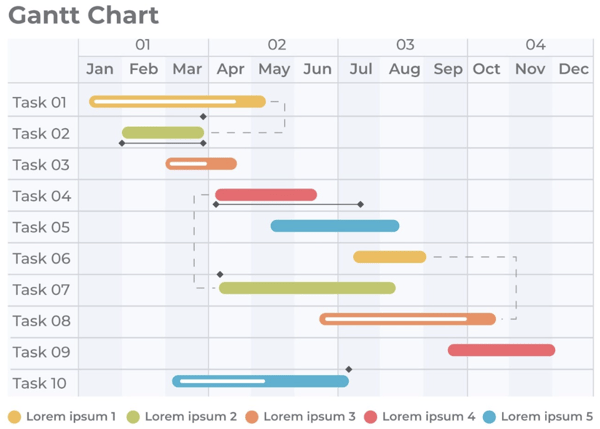
A Gantt chart comprises a timeline, dateline, milestones, dependencies, a measure of the task-by-task progress, and resources assigned.
The use of a Gantt chart in project management
Creating and managing a wide-ranging project: the purpose of a Gantt chart is to visualize and illustrate a project’s building blocks and break them down into manageable, achievable and smaller chunks of tasks.
To understand task dependencies and logistics: Project managers use Gantt charts to control and regulate project logistics. The role of task dependencies is to ensure that the team only begins a new task once the dependent one has been completed. Dependent tasks are rescheduled automatically in case the other task is overdue.
Evaluate and track the project’s progress: Using a Gantt chart, project managers can conveniently monitor a project’s health and make any revisions or amendments if needed. A Gantt chart provides you with key metrics such as milestones or release dates to make you easily track the project’s progress.
Find out how Gantt charts can help you manage agile epics more effectively in our informative article.
Who uses Gantt charts?
From project managers to team leaders, consulting agencies to business owners, everyone makes use of a Gantt chart to plan, schedule, and implement their projects. Other industries where Gantt charts may be used include marketing firms, the construction sector, manufacturing industries, software development, and the human resource department.
When is a Gantt chart helpful to use?
A Gantt chart may prove to have irreplaceable importance when your project’s planning stretches beyond a generic to-do list. You might want to use a Gantt chart when:
-
There are a number of individuals and teams involved in the project completion.
-
You are working with a hard deadline.
-
There is a certain degree of complexity that comes with your project, even if that simply means following a chronological order to complete the tasks.
-
Your team leader or client wants to see a visual of the project’s timeline.
-
You can make a decent, rough estimate of how much time could be taken to complete each task listed in the project.
What you need to create a Gantt chart
It is rather challenging to create a Gantt chart without having basic information about the project. Hence it is advisable to start by answering a few straightforward questions first. Some of these include:
-
Identifying major project deliverables.
-
The technique towards achieving those deliverables and a probable deadline.
-
Milestones that need to be achieved.
-
Recognizing any dependencies which may impact the project timeline.
-
Completion of project team members and their assigned tasks.
Building a simple Gantt chart in a few minutes
Follow these steps to make a simple yet convenient Gantt chart for your next project within minutes.
Step 1: Set up your project details
The first step is to begin mapping out the project tasks on the Gantt chart timeline and collecting relevant project details. Find a name and a start date for your project, as well as the days of the week you are interested in working on.
Step 2: Add tasks to your project
As you create your project timeline, start adding tasks to the Gantt chart outline. Keep naming the tasks, add them to the chart and repeat the operation until you have all the tasks pending.
Step 3: Schedule your tasks
The next step is to schedule all the tasks on your to-do list, and you can simply do it by dragging and dropping them one by one on the timeline. It is super simple to click on your project timeline, choose the date you want to schedule the task for and drag the bar accordingly.
Step 4: Add important project milestones
Adding milestones to the Gantt chart is very convenient, as it allows you to keep track of project deadlines, key meetings with team members, and any important events or deliverables. Adding milestones is similar to adding tasks, where each milestone is named, dragged and scheduled.
Step 5: Add dependencies to the tasks that need them
Now you can add any dependencies to your tasks according to where they are needed.
Step 6: Invite people to your project and assign tasks to those responsible
You can always invite more people to your project in case you think that the tasks could be assigned to people other than your current team.
Step 7: Apply task colors to enhance visualization on your Gantt chart
It is absolutely fun, easy and understandable to add color to your Gantt chart, which helps you take a quick look at important issues while studying the project timeline.
The most effective practices to create your next Gantt chart
-
When it comes to planning and executing projects, attention to detail is key. One way to ensure success is to get granular with your tasks. By breaking down each task into smaller, more manageable steps, you'll have a better understanding of progress and what needs to be done to achieve your goals. To help with this, refer back to your work breakdown structure and list out each step you took to create it.
-
Another helpful tip is to organize your tasks into groups or phases. This not only makes your plan easier to read and understand, but it also allows your team and stakeholders to see what tasks are part of a larger deliverable or phase. By grouping related tasks together, you can also identify potential dependencies and adjust your timeline accordingly.
-
Finally, don't forget to add important details and documents to each task. This can be especially helpful when working with a team or clients who may forget commitments or have questions about a specific task or group. Use the notes section of your plan and consider uploading key files directly to each task. By doing so, you can ensure that everything is ready and waiting for work to begin, helping you stay organized and on track toward project success.
The pros and cons of using a Gantt chart
The pros
Visualize your entire project
If you want to ensure your project is a success, it's important to have a clear and comprehensive plan. However, even the best-laid plans can go awry, which is why visualizing your entire project can be incredibly helpful. With a Gantt chart, you can get a start-to-finish view of your entire project timeline and track progress in real-time. This allows you to provide up-to-the-minute status reports to managers and stakeholders with ease.
See how tasks are connected
Another key benefit of modern Gantt charts is the ability to see how tasks are connected through dependencies. This feature makes it easy to shift tasks around without disrupting the overall flow of the project. As you make changes to your timeline, you can be sure that all tasks are still connected and on track.
Keep everyone on the same page and on time
Of course, clear communication is also crucial for project success. That's why all project information and discussion threads are centralized in one hub, making it easy for everyone to access and stay on the same page. By facilitating team collaboration, you can keep everyone on track and on time, reducing the risk of delays and cost overruns.

Do Gantt charts have limitations?
When it comes to project management, traditional desktop apps have their limitations. However, the cons often associated with Gantt charts simply don't apply to modern, online Gantt chart software. Thanks to the latest advancements, a whole new era of project management has arrived.
Modern Gantt charts offer a clean and simple design that's easy to use, with drag-and-drop scheduling that allows you to build and adjust project plans quickly and easily. And because everything happens online, it's a breeze to share plans, collaborate on work, update tasks, and track progress in real-time. Whether you're working with a team or managing a project solo, online Gantt charts offer unparalleled flexibility and convenience.
If you are looking for a powerful and user-friendly product management tool, Harvestr has got you covered with its robust features and intuitive interface, allowing you to streamline your product development process and stay ahead of the competition.
Frequently Asked Questions
How do I do a Gantt chart in Excel?
To create a Gantt chart in Excel, you can use the stacked bar chart function. First, list your project tasks in a table with start and end dates, then insert a stacked bar chart with the dates as the X-axis and the task names as the Y-axis. Finally, format the chart to display bars that correspond to the task duration and add additional details as needed.
Is Excel good for Gantt charts?
Yes, Excel can be used to create Gantt charts, and it is a good option for those who are already familiar with the software. However, dedicated Gantt chart software may offer more advanced features and greater ease of use, particularly for larger or more complex projects.
What are the 4 components of a Gantt chart?
The four main components of a Gantt chart are tasks, timelines, dependencies, and progress. Tasks are the individual activities required to complete the project, while the timeline shows when each task will take place. Dependencies indicate how tasks are related to one another, and progress tracking helps monitor project status and identify potential delays or issues.
What are the 5 steps to building a Gantt chart?
The five steps to building a Gantt chart are:
-
Defining the project scope and identifying all project tasks
-
Establishing task dependencies
-
Estimating the duration of each task
-
Laying out the tasks on the timeline
-
Adding progress tracking and milestones to monitor the project's status.